WebChart Control Sample - Bar Charts

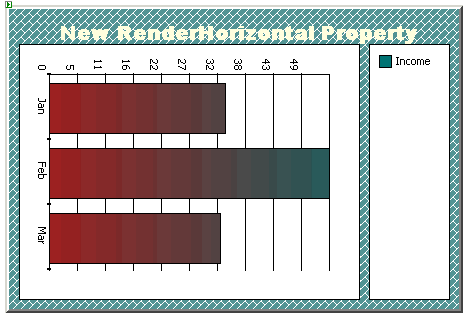
Sample of using RenderHorizontally to display charts horizontally
When designing the WebChart I wrongly assumed charts will always use vertical axis, this turn out to be a terrible design that really shown to be a very bad limitation in the control.
Unfortunately by the time I release the control, I didn't had the time to change this design, and changing it now will imply breaking a lot of applications that are built on top of this control.
Therefore, I had to come up with a feature to allow users that need horizontal charts to be able to used them. Enter RenderHorizontally property...
The output of this will look as follows:
C# Code
<web:chartcontrol runat="server" id="chart1" Height="300px" Width="450px" RenderHorizontally="True" ChartPadding="30" TopPadding="25" BorderStyle="Outset">
<Charts>
<web:ColumnChart Legend="Income" MaxColumnWidth="50" ShowLineMarkers="False">
<Fill Type="LinearGradient" Angle="90" ForeColor="Brown" LinearGradientMode="ForwardDiagonal" EndPoint="400, 400" Color="Teal" />
<Data>
<web:ChartPoint XValue="Jan" YValue="34"></web:ChartPoint>
<web:ChartPoint XValue="Feb" YValue="54"></web:ChartPoint>
<web:ChartPoint XValue="Mar" YValue="33"></web:ChartPoint>
</Data>
</web:ColumnChart>
</Charts>
<ChartTitle ForeColor="LightYellow" StringFormat="Center,Near,Character,LineLimit" Text="New RenderHorizontal Property" Font="Arial Black, 14.25pt, style=Bold" />
<Legend Width="80" />
<Background Type="Hatch" ForeColor="White" Color="CadetBlue" HatchStyle="DiagonalBrick" />
</web:chartcontrol>
Carlos Aguilar Mares © 2017