WebChart Control for ASP.NET
Frequently asked questions.
- I get an error when using the Chart saying System.ApplicationException: .... A generic error occurred in GDI+ and it looks like, something like this:
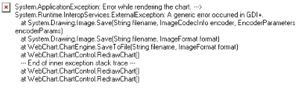
This means that the WebChart folder was created correctly, however the user (ASPNET or whatever user you are using if impersonation enabled) do not have write permissions on the folder.
For this you have to:- Open Windows Explorer (you can do Start Menu->Run…-> type explorer.exe ->Click OK)
- Browse to your application physical folder (typically c:\inetpub\wwwroot\YourAppName\)
- Inside that folder make sure you have a folder called WebCharts (if not create one,File Menu->New->Folder)
- Right click the folder and select properties
- In the Security Tab, make sure you have in the Users list the ASPNET account If not add it using the “Add..”button and type ASPNET and click OK
- Select the ASPNET account in the top list and make sure it has Read And Write permissions in that folder
- Click OK
- Click Start Menu and choose Run, and type CMD.exe
- Run the following commands:
Cacls.exe c:\inetpub\wwwroot\YourApp\WebCharts /T /E /G ASPNET:R
Cacls.exe c:\inetpub\wwwroot\YourApp\WebCharts /T /E /G ASPNET:W
Cacls.exe c:\inetpub\wwwroot\YourApp\WebCharts /T /E /G ASPNET:C
What they do is Edit the permissions of the folder and add Read, Write and Change permissions respectively. Just make sure to point to the right directory and using the correct account.
- Does it supports databinding: Yes, databinding is done at the Chart level, so you can add multiple charts to a same control that come from different sources. All you need to do is set the DataXValueField and DataYValueField in the chart class (ie. LineChart, ColumnChart, etc, but not in the ChartControl).
-
How can I bind to a DataSet?: Just set the DataXValueField, DataYValueField and DataSource to the DataView of the table you want to display, for example DefaultView in the code below.
Dim ds As DataSet = GetDataSet() Dim view As DataView = ds.Tables(0).DefaultView Dim chart As New SmoothLineChart() chart.Legend = "Value 1" chart.DataSource = view chart.DataXValueField = "Description" chart.DataYValueField = "Value1" chart.DataBind() ChartControl1.Charts.Add(chart) ChartControl1.RedrawChart() - It would appear that a new {GUID}.png file is being created for each request in the WebCharts folder. Yes, one chart will be created each time. Though it is not always the case, for example, if you do a postback (for example after the user changes his selection from some controls) from some browsers, it will reuse the same image. There is a reason for this, it is because after several hours of testing, someone reported me a bug that the chart was generated but it was not being displayed in some browsers, and essentially it was because they try to do some caching and so they don’t refresh the image correctly in postback even if I render the image again.
- Then I will have tons of images.No, the way the chart works, is that it will clean up the folder every now and then, the default is every 30 minutes, but you can customize this to clean every 10 minutes or whatever your needs are. There is a setting for this called AutoCleanUpInterval in the ChartControl that can be set in the web.config in the appSettings section as follows will change to clean up the folder for images older than 10 minutes:
<?xml version="1.0" encoding="utf-8" ?> <configuration> <appSettings> <add key="AutoCleanUpInterval" value="10" /> </appSettings> </configuration> - But it is not cleaning exactly every 10 minutes. For performance reasons, the chart will only do the check to clean up every AutoCleanUpInterval minutes, but only when a request comes, it does not span threads to check for this. So if not request comes, no cleaning will be made.
- So, can I set this to 1 minute. Yes you can. But one thing I wanted to recommend you is not having the AutoCleanUpInterval set to less than 5 minutes, since the way the browser works is that it will issue a GET (or POST) request to your page (.aspx) and receive the plain HTML generated, then it will start parsing the HTML and by the time it realizes there is a <img> tag it will issue a second request to get the actual image (chart). Now, imagine the case where there is a not so good browser, or a simply a slow internet/intranet connection that might take longer than 60 seconds to get for the image, then it might be the case that the chart image gets deleted and so you will receive and empty image instead of the chart.
- Can I change the folder where the images are stored to be something different? Yes. There are two properties you need to change for this, but they are static properties of the Chartcontrol so all charts will fall in the same folder.
        WebChart.ChartControl.PhysicalPath = "C:\MyFolder\MyCharts"
        WebChart.ChartControl.VirtualPath = "/MyFolder/MyCharts"
One thing you need to make sure is that the VirtualPath is the right way to get to the PhysicalPath, or else you will not see the images in the browser. This properties can be set in the Application_Start on Globals.asax or in a static constructor of a Page so it is only executed once. - Is there any other alternative? Can I create Charts without saving the image to disk? Yes. You can use the ChartEngine directly and create your own page or handler that does that. See this sample on how you can do this. Sample of using the Chart control without saving to the file system
- How can I add a label to a PieChart or how can I create a different Legend? Right now there is no extensibility for this. Having said that, you can create any legend you like in your page, for example using a DataList like in this page Sample: How to add a legend to a PieChart.
- My data has decimals in the YValue, however, I cannot get the Y axis grid values to display as 1.0, 1.5, 2.0, 2.5 , 3.0, 3.5 etc. My chart will show 1, 1, 2, 2, 3, 3
The control has a property called YValuesFormat, that allows to specify the format to use for the YValues, so you can customize it to show with decimals, exponentials, etc.
ChartControl1.YValuesFormat = "{0:N}"You can see all the formats in here: http://msdn.microsoft.com/library/default.asp?url=/library/en-us/cpguide/html/cpconstandardnumericformatstrings.asp -
How can I display data evenly for dates. I’m using the chart to display the monthly data. It works great, but if I have no data for a month, then the chart skips that month completely instead of displaying a zero. The control shifts some month values to the left-most column since that is the first month of that year even.
:
Try using ScatterChart. ScatterChart is the only type of chart that will parse the XValue of every point, and try to come up with a “nice” location for each point, instead of just plotting them from left to right.
You can set the XValueDataType, to whatever data type you have in X, for instance, Integer, Float or DateTime, so the chart can understand the data.
If you are using Dates, you can also set the DateRenderMode to Hours/Days/Weeks/Months/ or even Years, and the chart control will group them in intervals, to display things more evenly. (or you can leave it with Auto, and it will Scale automatically, to display in the best format).
Additionally, if you want to join the points with lines, specify the ScatterLinesOption (None, Lines, SmoothLines) -
Is it possible to disable the text-wrapping for the Y-Title or is there other way to display it horizontally or display the title in vertical manner
Yes, all text in the chart control can be displayed vertical, or you can even changed the trimming works (say trimming showing ellipisis), alignment etc.
The way to do it is with the ChartText class that encapsulates all texts in the Chart control, it has a property called StringFormat that you can change. This can be done programmatically or declaratively in the ASPX code. For example, if you want to change the XAxisFont to be black, and display vertically, just add this inside the chart control:<Web:ChartControl id="Chart1" runat="server" … <XAxisFont ForeColor="Black" StringFormat="Center,Center,Character,DirectionVertical" Font="Tahoma, 8pt" /> <YTitle ForeColor="Black" StringFormat="Center,Near,Character,DirectionVertical" Text="Bugs" Font="Tahoma, 8pt" /> </Web:ChartControl>This code will change the YTtitle to display vertical, and centered, and the XAxis to be vertical and centered.
If you want you can do it programmatically like:Chart1.YTitle.StringFormat.FormatFlags = StringFormatFlags.DirectionVertical; Chart1.YTitle.StringFormat.Alignment = StringAlignment.Near; - How can I add my own text/copyright info to the charts generated? For this you can use one of the Chart control features that allows you to set the background of any object including Plot Area, Chart Area, Chart columns, Legends, etc. to any image you have. You only need to set the Background type to Texture and optionally set the Wrap behavior you want. For example:
        Dim img As System.Drawing.Image = Bitmap.FromFile(Server.MapPath("copyright.bmp"))
        ChartControl1.Legend.Background.Image = img
        ChartControl1.Legend.Background.Type = WebChart.InteriorType.Texture
        ChartControl1.Legend.Background.WrapMode = Drawing2D.WrapMode.Tile
This code will generate the following image, notice that it is rendering a Text and an image in the Legend Box.
- ...
For new information on Builds and demos, please send email to webchart@carlosag.net or visit http://www.carlosag.net/
FOR USERS WITHOUT VS.NET
To use the control you just need to:- Add a reference to WebChart.dll in VS.NET and optionally you can add it to your toolbox.
- Add the correct register tag in the page:
<%@ Register TagPrefix="Web" Namespace="WebChart" Assembly="WebChart" %> - Add the simplest chart possible:
<web:chartcontrol id="chart" runat="server">
</Web> - From this point you can use the VS.NET designer to format your chart.
- BTW. Remember to call RedrawChart() whenever you want the chart to be redrawn
(usually in Page_Load or after changing the data, etc) if not you will only
receive an empty image, this is by design to avoid redrawing unnecesary charts for performance.
FOR USERS OF VS.NET
The steps above are only needed if you like doing things manually, with VS.NET things can be easier:- Open or Create a New Web Project in the language of your choice
- Just open your toolbox (if it does not appears click Ctrl+Alt+X)
- Right click on it and Select the option “Customize Toolbox”
- select the Tab “.NET Framework Components”, then click “Browse…” and just search for the extracted WebChart.dll file.
- Doing this, will add a small chart icon in your toolbox, and now, you can just drag/drop it in the VS.NET Designer, and it will actually add the reference automatically for you in any web project.
- From this point, you can add/remove charts from the designer, use the AutoFormat task (right click on the chart) to customize look & feel. etc
SETUP KNOWN ISSUES:
    The way the chart works is rendering the charts into a folder called WebCharts, so, if the folder does not exist,
        it tries to create it, so it can store the charts there.
    One known issue is with Windows XP, and probably Win 2K3, that they do not grant write permission to the folders to the
    ASPNET account (or Network Service account).
    So just to be sure, if the chart is working on the vs.net designer, but it is not working when seeing the actual page:

    1) Under your application virtual directory create a folder named WebCharts
    2) grant NTFS write permissions to the ASPNET account (be sure not to grant write permissions in the IIS MMC since that could be a security hole).

    Try again.


    So for example if your virtual directory is named MyApplication and lives in the default dirs.
    You would need to create
    C:\inetpub\wwwroot\MyApplication\WebCharts\

    And assign read and write permissions to ASPNET account.

    If this doesn’t work, tell me and we will find out a solution quickly.
    And please check the Application Event log to see if there are any (Application) errors to give us a clue.

    Thanks for using the WebChart control.

    Carlos


    More details on troubleshooting:

    If you find this exception, it means it is trying to write an error to the event viewer, and it couldnt gain access to it.
    This is normally because of Write Permissions on the registry.
    So the problem usually is because it couldn't create the WebCharts folder mentioned above, so follow the steps mentioned above.

    Security Exception
    Description: The application attempted to perform an operation not allowed by the security policy.
    To grant this application the required permission please contact your system administrator or change the application's trust level in the configuration file.
    Exception Details: System.Security.SecurityException: Requested registry access is not allowed.
Carlos Aguilar Mares © 2017