DbDiagrams for WebMatrix
DbDiagrams is an add-in for the latest version of WebMatrix, that allows you to generate diagrams for different databases including Microsoft SQL Server and Microsoft Access.
This is how the DbDiagrams window looks like:
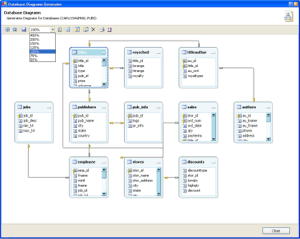
Figure 1: DbDiagrams window.
Free Download:
Please send any comments to dbdiagrams@carlosag.net.Click Here to Start Download
Number of Downloads: <%= string.Format("{0}", Globals.Downloads["DbDiagrams.zip"]) %>
How to Use
To use the Add-In you first need to register it in WebMatrix.Register the Add-In
- Launch Matrix from “StartàProgramsàMicrosoft
ASP.NET Web MatrixàASP.NET Web Matrix”
- Select the option “Organize Add-ins…” from the Tools menu
- In the Select Components dialog, click the “Browse…” button and search for the DbDiagrams.dll. Click Ok. Click Ok.
- Back in the ”Organize Add-ins”, you will see the add-in that was just registered. Select the checkbox to make this add-in available from the Tools menu.
- By this time, you should have a new option inside the Tools menu that shows the "Database Diagram".
Launching the Add-In
To start using the Add-In, you first need to be in a Table document. What this means is that first you need to open a database table in Matrix for the Add-In to enable.Adding a new Database Connection to WebMatrix
|
Open WebMatrix and in the Solution Explorer, select the "Data" Tab.
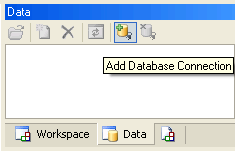
Click the "Add Database Connection" button at the top of this window. |
 |
|
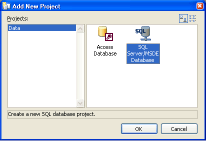
In the "Add new Project" dialog selec the type of database you want to connect to.
In this case we will connect to SQL Server. |
 |
|
In the "Connect to Database" dialog, specify the settings for your connection. Click Ok. |
 |
|
Back in the Data Explorer, expand until the tables are shown. Double click on any of the tables. This will enable the "Database Diagram" menu. |
 |
|
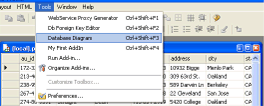
At this point click on the Tools menu, and you will see the option "Database Diagram" enabled. Select this. |
 |
Commands

- Show Grid:Displays a grid so you can align easier the shapes
- Snap To Grid:Makes the shapes align to the grid to facilitate the layout of the shapes
- Save:Allows you to save the diagram as image (jpg, bmp, gif, png, tif, etc)
- Zoom:Allows you to change the zoom of the current view
- Layout Tables:Arranges the tables automatically
- Show DataTypes:Shows/Hides the datatypes of the columns
- Refresh:Regenerates the diagram
- Add Tables:Allows you to add tables not shown in the diagram
- Remove Table:Allows you to remove the selected tables from diagram
- Print:Prints the diagram
- Print:Allows you to specify the page settings for the printer
Requirements:
- No additional requirements. If WebMatrix database functionality works, this works
Carlos Aguilar Mares © 2017
