WebChart Tutorial
Generating Charts in ASP.NET
Summary
This is a small tutorial on how to use the WebChart Control that is free.Contents
Introduction
The WebChart control is built 100% using C#, and pure Managed Code. All the drawing is made using System.Drawing.Graphics class. It supports several types of Charts including:
- AreaChart
- StackedColumnChart
- ScatteredChart
- LineChart
- SmoothLineChart
- PieChart
- ColumnChart
- StackedAreaChart
All the charts are derived from a base class called Chart, and you can create your own charts by inheriting from this class and overriding the Render method.
This is a small tutorial to jumpstart you with the Chart control, it uses the minimum functionality of the control, so after completing this tutorial, play around with the object model (OM) it exposes to create the right charts for you. You can even extend the object model to create your own charts by inheriting the Chart class to accommodate your needs. All classes are not se sealed so you can inherit from them and you can override their behavior if you want.
Web Tutorial using the Control in VS.NET
This tutorial will show you how to Start using the control from an ASP.NET Application using VS.NET.|
1) Run Visual Studio.NET Click the menu "Start->Programs->Microsoft Visual Studio.NET->Microsoft Visual Studio .NET". |
|
|
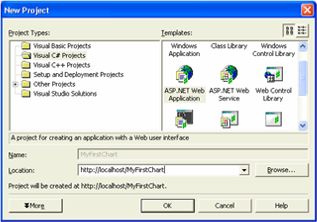
2) Create a new ASP.NET Web Application Click the menu "File->New->Project" In the "New Project" Dialog select the language of your choice. For now lets just select "Visual C# Projects" in the Project Types treeview and select "ASP.NET Web Application" in the Templates list. Specify a name for it. The dialog should look like the following image. Click OK. |
 |
|
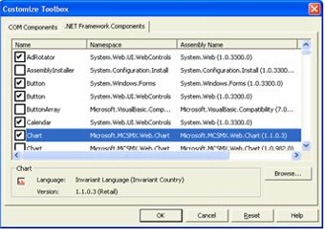
3) Add the WebChart control to the toolbox This is an optional step, but it makes life easier if you plan on using the control on more than one project, since it will no longer require you to add references, nor copy the control, etc. While in the WebForms Designer. Select the option menu "View->Toolbox". Right click on it and select the option Customize Toolbox. Once in the "Customize Toolbox" Dialog, select the “.NET Framework Components” Tab. Click the Browse button. 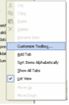 And look for the file WebChart.dll. Click Ok. The dialog should look as follows. Click Ok. |
 |
|
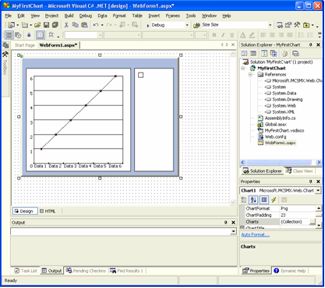
4) Add a Chart to the WebForm To Add a Chart to the WebForm, you can just Drag a Chart control (added in the previous step to the toolbox, look for the small chart glyph) |
 |
|
5) Add some formatting to the chart You can add easily formatting to your chart by right clicking on it and selecting the option “Auto format…” or from the Property Grid. |
 |
|
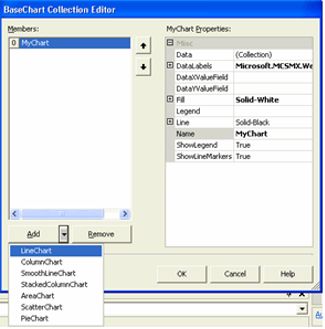
6) Add a Chart to the control You can add the charts either from code or from design time. It is easier to do in design time, since doing this way, you can actually get a WYSIWYG version of the control without even having to run it. To add a chart in Design Time, just double click the Charts… Property in the Property Window. 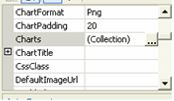 This will launch the Chart Editor, where you can add any type of Chart (LineChart, ColumnChart, etc) by choosing the drop down button at the bottom of the dialog and configure all their properties. So for now, Add a LineChart and assign it a Name of “MyChart”, and click Ok. |
 |
|
7) Add code to add points and render the chart Double click on the Designer to take you to the Page_Load event of your page. Add a using statement at the top of the page code to avoid writing the namespace in all your declarations.
using System;
using System.Collections; // Other namespaces... using WebChart; Now add some code to add the points to the chart. All points in the Chart are represented with the ChartPoint class. So in the code below we first grab a reference to the Chart already in the control (since it was added in design time), and then use its Data property to add the Points. Note that you need to cast the chart to the correct type of chart, since it returns a Chart class that is the base class for all charts. At the end we call RedrawChart method that creates the file. THIS IS REALLY IMPORTANT, every time you want the control to redraw the chart, you need to explicitly call this method, if you fail to do so, it will not create the image file.
private void Page_Load(object sender, System.EventArgs e) {
LineChart chart = (LineChart)ChartControl1.Charts.FindChart("MyChart"); chart.Data.Add( new ChartPoint("Jan", 10) ); chart.Data.Add( new ChartPoint("Feb", 20) ); chart.Data.Add( new ChartPoint("Mar", 30) ); ChartControl1.RedrawChart(); If you don’t add the charts in design time you can also add them by code like this:
private void Page_Load(object sender, System.EventArgs e) {
LineChart chart = new LineChart(); chart.Data.Add( new ChartPoint("Jan", 10) ); chart.Data.Add( new ChartPoint("Feb", 20) ); chart.Data.Add( new ChartPoint("Mar", 30) ); ChartControl1.Charts.Add(chart); ChartControl1.RedrawChart(); Notice that you will need to add it to the Charts collection of the control. |
|
|
8) Compile and Run the page. |
|
Web Tutorial using the Control in VS.NET
This tutorial will show you how to Start using the control from an ASP.NET Application using WebMatrix.Web Matrix is a development tool for asp.net that you can download free from http://www.asp.net/
|
1) Run WebMatrix Click the menu "Start->Programs->Microsoft ASP.NET Web Matrix->ASP.NET Web Matrix". |
|
|
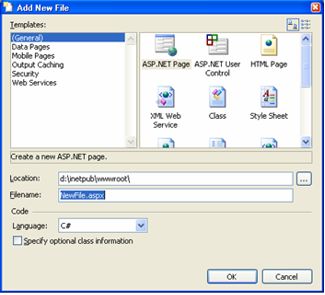
2) Create a new ASP.NET Web Application Click the menu "File->New File...". In the Add New File Dialog select the option "ASP/NET Page" |
 |
|
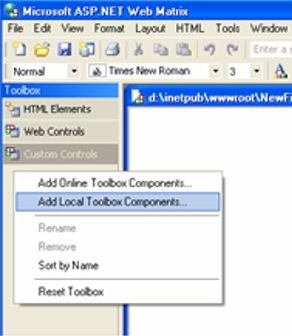
3) Add the Chart control to your toolbox In the toolbar select the tab named "Custom Controls". Right click the toolbar and select the option "Add Local Toolbox Components…" In the dialog that shows. Click the browse… button and search for the Web.Chart.dll in your local file system. Select it and click Ok to close both windows. WebMatrix will give you the option to add the control to the GAC. If you want you can do this, but it is not necessary, and I don’t like doing that to allow more easily to deploy the application without any concerns of registering assemblies into the GAC, so for now, let just click NO.  WebMatrix will issue a warning saying that you will need to copy the Dll into the bin directory of your application virtual directory. Click Ok. 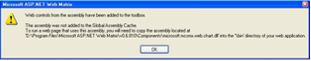 |
 |
|
2) Create a new ASP.NET Web Application Click the menu "File->New File...". In the Add New File Dialog select the option "ASP/NET Page" |
|
|
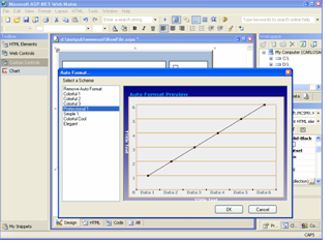
4) Add some formatting to the chart WebMatrix will give you all the design time features that you need to create nice charts. So click on the Properties Window, the Autoformat link at the bottom |
 |
|
5) Add code to create charts Just as in VS.NET you will need code to create the charts so you can copy/paste this code:
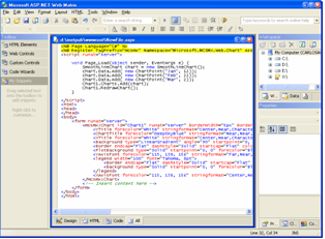
<script runat='server'>
void Page_Load(object sender, EventArgs e) { SmoothLineChart chart = new SmoothLineChart(); chart.Data.Add( new ChartPoint("Jan", 12)); chart.Data.Add( new ChartPoint("Feb", 22)); chart.Data.Add( new ChartPoint("Mar", 2)); ChartControl1.Charts.Add(chart); ChartControl1.RedrawChart(); } </script The page should look as in the image. |
 |
|
6) Copy the DLL into your bin directory
Since we are not registering the DLL into the GAC, then we need to make sure the dll is deployed to the Bin directory inside our Web application. So create a Bin folder inside your root application, and copy there the file. Note: If you are using Windows XP or Windows 2003, you might also want to save some time and create the WebCharts folder to avoid security problems. See the Known issues in the Readme. |
|
|
7) Start Cassini or browse using IIS
Just as in VS.NET you can press F5 or select the option Start… from the View Menu. This will prompt to you if you want to use Cassini or IIS to browse your page. For now just select the default and click OK. |
|
Carlos Aguilar Mares © 2017