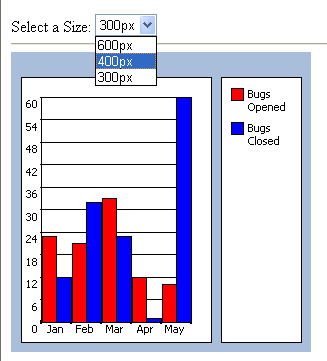
Sample of resizing the control programmatically
When trying to resize the chart dynamically you might find that you end up in the client side with a "stretched image" that is being adjusted in the client side instead of actually redrawing the chart using the settings that you set.
The reason for this is that you need to call RedrawChart so the Chart reads the Width and Height settings and regenerates the image using that size so the chart generation uses this scale and generates a much better image.
Here is a sample that you can copy/paste into a .ASPX file inside a virtual directory and should work.
This is a snapshot of the page that is in the code below.

C# Code
<%@ page language="C#"%>
<%@ Register tagPrefix="web" assembly="WebChart" namespace="WebChart" %>
<script runat="server">
void Page_Load (object o, EventArgs e) {
if (Page.IsPostBack==false) {
AddCharts();
}
}
void AddCharts() {
int size = int.Parse(ddlSize.SelectedValue);
chartControl.Width = size;
chartControl.Height = size;
ColumnChart openedBugs = new ColumnChart ();
openedBugs.Fill.Color = System.Drawing.Color.Red;
openedBugs.Legend = "Bugs Opened";
openedBugs.Data.Add(new ChartPoint("Jan", 23));
openedBugs.Data.Add(new ChartPoint("Feb", 21));
openedBugs.Data.Add(new ChartPoint("Mar", 33));
openedBugs.Data.Add(new ChartPoint("Apr", 12));
openedBugs.Data.Add(new ChartPoint("May", 10));
chartControl.Charts.Add(openedBugs);
ColumnChart closedBugs = new ColumnChart ();
closedBugs.Fill.Color = System.Drawing.Color.Blue;
closedBugs.Legend = "Bugs Closed";
closedBugs.Data.Add(new ChartPoint("Jan", 12));
closedBugs.Data.Add(new ChartPoint("Feb", 32));
closedBugs.Data.Add(new ChartPoint("Mar", 23));
closedBugs.Data.Add(new ChartPoint("Apr", 1));
closedBugs.Data.Add (new ChartPoint ("May", 60));
chartControl.Charts.Add(closedBugs);
chartControl.RedrawChart();
}
void ddlSize_OnSelectedIndexChanged(object o, EventArgs e) {
AddCharts();
}
</script>
<html>
<head>
<title>Sample</title>
</head>
<body>
<form id="form1" runat="server">
Select a Size:
<asp:dropDownList runat=server id=ddlSize autopostback=true onselectedindexchanged="ddlSize_OnSelectedIndexChanged">
<asp:ListItem value="600">600px</asp:ListItem>
<asp:ListItem value="400">400px</asp:ListItem>
<asp:ListItem selected=true value="300">300px</asp:ListItem>
</asp:dropDownList>
<hr />
<web:ChartControl legend-width=80 runat=server id=chartControl />
</form>
</body>
</html>
Carlos Aguilar Mares © 2017
