WebChart Control Sample - Generating a Chart without saving to file
Another sample of using the Chart control without saving to the file system
For more information see this sample (very similar)
So, I've received a lot of questions about how to set some properties using the ChartEngine directly and not the using ChartControl to avoid saving to the file system.
The most common questions are:
- Can I set '<propertyname>' programmatically? Yes. You can do exactly the same things you can do using the ChartControl class. Absolutely all properties are accessible using the classes directly.
- With some properties I get a NullReferenceException The reason for this is that I designed the ChartEngine class to be used by a wrapper (ChartControl) who knows which classes need to be created and will initialize them appropriately, however for performance reasons I don't initialize them so potentially someone can reuse the same object (say a ChartInterior instance). This might change in the future to simplify the development using ChartEngine, but of course necer making a trade-off with performance.
- ...
To run it, just save the code into a .ASPX and browse to it. (Note that this sample does not require creating the WebCharts folder, etc), just copy the WebChart.dll in the \bin\ directory and browse to the page.
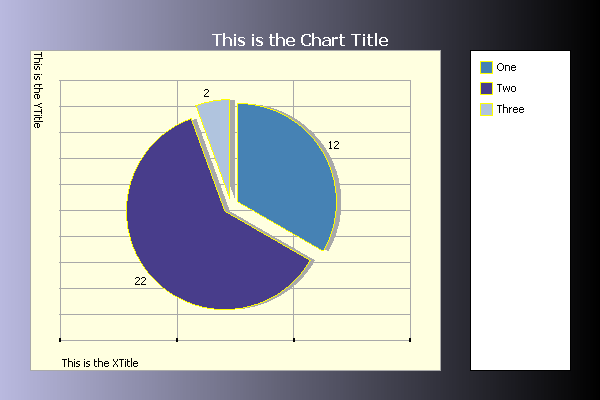
This is the way the generated image will look like:
<%@ Page Language="VB"
contenttype="image/png"
%>
<%@ Import Namespace="System.Drawing" %>
<%@ Import Namespace="WebChart" %>
<script runat=server>
Sub Page_Load(ByVal o As Object, ByVal e As EventArgs)
Dim wcEng As New ChartEngine()
wcEng.Size = New Size(600, 400)
Dim wcCharts As New ChartCollection(wcEng)
wcEng.Charts = wcCharts
Dim slChart As New PieChart()
slChart.Line.Color = Color.Yellow
slChart.Legend = "Watts"
slChart.ShowLineMarkers = False
slChart.ShowLegend = True
slChart.DataLabels.Visible = True
slChart.Shadow.Visible = True
slChart.Explosion = 8
slChart.Data.Add(New ChartPoint("One", 12))
slChart.Data.Add(New ChartPoint("Two", 22))
slChart.Data.Add( New ChartPoint("Three", 2))
wcCharts.Add(slChart)
SetMoreProperties(wcEng)
Dim bmp As Bitmap
Dim memStream As New System.IO.MemoryStream()
bmp = wcEng.GetBitmap()
bmp.Save(memStream, System.Drawing.Imaging.ImageFormat.Png)
memStream.WriteTo(Response.OutputStream)
Response.End()
End Sub
' This are all Optional properties, You can call this method to change the look of your chart
Private Sub SetMoreProperties(ByVal engine As ChartEngine)
' Set-up the XTitle
Dim myFont As New System.Drawing.Font("Tahoma", 8)
engine.XTitle = New ChartText()
engine.HasChartLegend = true
engine.Border.Color=Color.DarkGray
engine.GridLines = WebChart.GridLines.Both
Dim horizontalFormat As New StringFormat()
horizontalFormat.LineAlignment = StringAlignment.Far
engine.XTitle.StringFormat = horizontalFormat
engine.XTitle.Text = "This is the XTitle"
engine.XTitle.Font = myFont
' Set-up the YTitle
engine.YTitle = New ChartText()
engine.YTitle.Font = myFont
Dim verticalFormat As New StringFormat()
verticalFormat.FormatFlags = StringFormatFlags.DirectionVertical
verticalFormat.Alignment = StringAlignment.Near
engine.YTitle.StringFormat = verticalFormat
engine.YTitle.Text = "This is the YTitle"
' Set-up the Title
engine.Title = New ChartText()
engine.Title.ForeColor = Color.White
engine.Title.Font = new Font("Tahoma", 12, FontStyle.Bold)
engine.Title.Text = "This is the Chart Title"
' Specify show XValues
engine.ShowXValues = True
engine.ShowYValues = True
' Some padding
engine.Padding = 30
engine.ChartPadding = 30
' some color
engine.Background.Type = InteriorType.LinearGradient
engine.Background.EndPoint = new Point(600,600)
engine.Background.Color = Color.FromArgb(70, Color.DarkBlue)
' some color
engine.PlotBackground.Color = Color.LightYellow
End Sub
</script>