WebChart Control Sample - Stacked Charts

Sample of using DataLabels
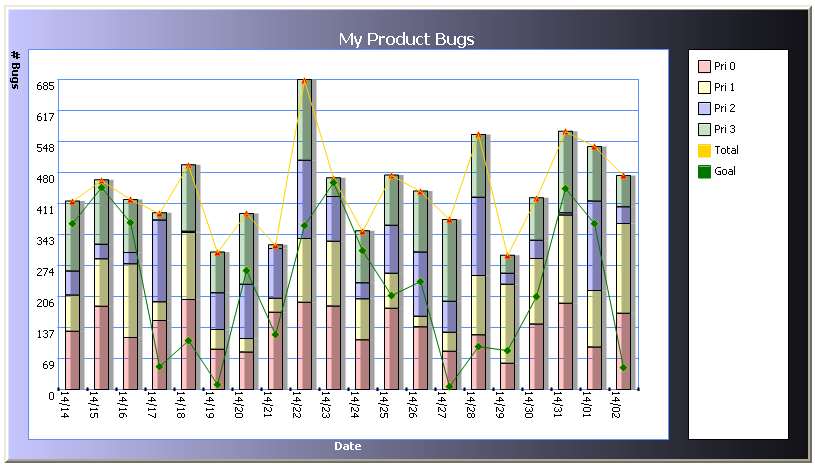
This sample shows:
- How you can display the values of the YValues on top of the actual point (in this case the column) using DataLabels. Of course you can change the format of the label as well as the background color and the border for the label that will be displayed using the properties of the DataLabel class.
- It also shows how you can set the maximum column width of a ColumnChart so it does not fills the whole space using MaxColumnWidth. This applies for each ColumnChart you add, so you can customize that some charts use more space than others.
- It finally shows how you can change the maximum value of the chart using YCustomEnd so that it will use this to scale the chart. You can also change the start point by using the YCustomStart to change it to not start from 0 (or the minimum value).
This is how the chart looks like, just copy/paste the code into notepad and save it as .aspx:
C# Code
<%@ Page Language="C#" %>
<%@ Register TagPrefix="web" Namespace="WebChart" Assembly="WebChart" %>
<%@ Import Namespace="System.Data" %>
<%@ Import Namespace="System.Drawing" %> <script runat="server">
void Page_Load(object o, EventArgs e) {
CreateChart();
}
void CreateChart() {
DataSet ds = CreateDataSet();
StackedColumnChart chart = new StackedColumnChart();
chart.Fill.Color = Color.FromArgb(50, Color.Red);
chart.Shadow.Visible = true;
chart.MaxColumnWidth = 15;
chart.Legend = "Pri 0";
StackedColumnChart chart1 = new StackedColumnChart();
chart1.Fill.Color = Color.FromArgb(50, Color.Yellow);
chart1.Shadow.Visible = true;
chart1.Legend = "Pri 1";
StackedColumnChart chart2 = new StackedColumnChart();
chart2.Fill.Color = Color.FromArgb(50, Color.Blue);
chart2.Shadow.Visible = true;
chart2.Legend = "Pri 2";
StackedColumnChart chart3 = new StackedColumnChart();
chart3.Fill.Color = Color.FromArgb(50, Color.Green);
chart3.Shadow.Visible = true;
chart3.Legend = "Pri 3";
LineChart chart4 = new LineChart();
chart4.Line.Color = Color.Gold;
chart4.Fill.Color = Color.Gold;
chart4.LineMarker = new TriangleLineMarker(6, Color.Red, Color.Gold);
chart4.Legend = "Total";
LineChart chart5 = new LineChart();
chart5.Line.Color = Color.Green;
chart5.Fill.Color = Color.Green;
chart5.LineMarker = new DiamondLineMarker(8, Color.Green, Color.Yellow);
chart5.Legend = "Goal";
foreach(DataRow row in ds.Tables[0].Rows) {
chart.Data.Add(new ChartPoint(row["date"].ToString(), (int)row["pri0"]));
chart1.Data.Add(new ChartPoint(row["date"].ToString(), (int)row["pri1"]));
chart2.Data.Add(new ChartPoint(row["date"].ToString(), (int)row["pri2"]));
chart3.Data.Add(new ChartPoint(row["date"].ToString(), (int)row["pri3"]));
chart4.Data.Add(new ChartPoint(row["date"].ToString(), (int)row["total"]));
chart5.Data.Add(new ChartPoint(row["date"].ToString(), (int)row["goal"]));
}
chartControl1.Charts.Add(chart);
chartControl1.Charts.Add(chart1);
chartControl1.Charts.Add(chart2);
chartControl1.Charts.Add(chart3);
chartControl1.Charts.Add(chart4);
chartControl1.Charts.Add(chart5);
chartControl1.RedrawChart();
}
/// <summary>
/// Just generate some random data
/// </summary>
DataSet CreateDataSet() {
DataSet ds = new DataSet();
DataTable table = ds.Tables.Add("Table");
table.Columns.Add("date");
table.Columns.Add("pri0", typeof(int));
table.Columns.Add("pri1", typeof(int));
table.Columns.Add("pri2", typeof(int));
table.Columns.Add("pri3", typeof(int));
table.Columns.Add("total", typeof(int));
table.Columns.Add("goal", typeof(int));
Random rnd = new Random();
for (int i = 0; i < 20; i++) {
DataRow row = table.NewRow();
row["date"] = DateTime.Now.AddDays(i).ToString("mm/dd");
int pri0 = rnd.Next(200);
int pri1 = rnd.Next(200);
int pri2 = rnd.Next(200);
int pri3 = rnd.Next(200);
int sum = pri0 + pri1 + pri2 + pri3;
int goal = rnd.Next(sum);
row["pri0"] = pri0;
row["pri1"] = pri1;
row["pri2"] = pri2;
row["pri3"] = pri3;
row["total"] = sum;
row["goal"] = goal;
table.Rows.Add(row);
}
return ds;
}
</script>
<html>
<head>
<title>Untitled Page</title>
</head>
<body>
<form id="form1" runat="server">
<web:ChartControl Runat="server" ID="chartControl1" ChartPadding="30" BottomChartPadding="20"
TopPadding="20" Padding="20" Width="800" Height="450" BorderStyle="outset">
<Background Type="LinearGradient" Color="#ccccff" EndPoint="900,900" />
<Border Color="#6699ff" />
<ChartTitle Text="My Product Bugs" Font="Tahoma, 12pt, style=Bold" ForeColor="White" />
<XAxisFont StringFormat="Near, Near, Character, DirectionVertical" />
<XTitle Text="Date" Font="Tahoma, 8pt, style=Bold" ForeColor="White" />
<YTitle Text="# Bugs" Font="Tahoma, 8pt, style=Bold" StringFormat="Near, Near, Character, DirectionVertical" />
</web:ChartControl>
</form>
</body>
</html>
Carlos Aguilar Mares © 2017