WebChart Control Sample - Generating a chart using a DataSet

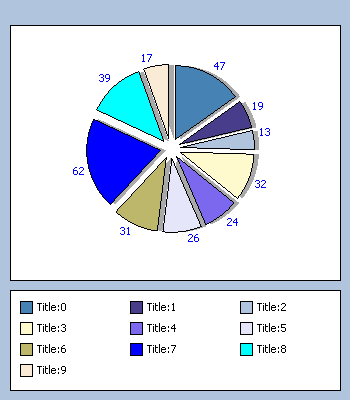
Sample of Binding a Pie to a DataSet
This sample shows:
- How you can Bind a DataSet to any type of chart. In this case the DataSet is created locally, but it works exactly as it came from SQL Server or any other source. The only trick on making it work is that you need to assign it to a DataView since the chart only supports IEnumerable types and DataSet is not, so select the table you need and get a DataView for it. Then just set the DataXValueField and DataYValueField.
C# Code
<%@ page language="C#"%>
<%@ import namespace="System.Data"%>
<%@ register tagprefix="web" namespace="WebChart" assembly="WebChart"%>
<script runat="server">
void Page_Load(object o, EventArgs e) {
CreateChart();
}
void CreateChart() {
PieChart chart = new PieChart();
chart.DataSource = GetDataSet().Tables[0].DefaultView;
chart.DataXValueField = "Title";
chart.DataYValueField = "Price";
chart.DataLabels.Visible = true;
chart.DataLabels.ForeColor = System.Drawing.Color.Blue;
chart.Shadow.Visible = true;
chart.DataBind();
chart.Explosion = 10;
ChartControl1.Charts.Add(chart);
ChartControl1.RedrawChart();
}
DataSet GetDataSet() {
DataSet ds = new DataSet();
DataTable table = ds.Tables.Add("My Table");
table.Columns.Add(new DataColumn("Title"));
table.Columns.Add(new DataColumn("Price", typeof(int)));
Random rnd = new Random();
for (int i = 0; i < 10; i++) {
DataRow row = table.NewRow();
row["Title"] = "Title:" + i.ToString();
row["Price"] = rnd.Next(1, 100);
table.Rows.Add(row);
}
return ds;
}
</script>
<html>
<head>
<title>
Sample Pie</title>
</head>
<body>
<form id="form1" runat="server">
<web:chartcontrol runat="server" id="ChartControl1"
height="400" width="350" gridlines="none" legend-position="Bottom" />
</form>
</body>
</html>
VB.NET Code
<%@ page language="VB"%>
<%@ import namespace="System.Data"%>
<%@ register tagprefix="web" namespace="WebChart" assembly="WebChart"%>
<script runat='server'>
Sub Page_Load(ByVal o As Object, ByVal e As EventArgs)
CreateChart
End Sub
Sub CreateChart()
Dim chart As PieChart = New PieChart
chart.DataSource = GetDataSet.Tables(0).DefaultView
chart.DataXValueField = "Title"
chart.DataYValueField = "Price"
chart.DataLabels.Visible = true
chart.DataLabels.ForeColor = System.Drawing.Color.Blue
chart.Shadow.Visible = true
chart.DataBind
chart.Explosion = 10
ChartControl1.Charts.Add(chart)
ChartControl1.RedrawChart
End Sub
Function GetDataSet() As DataSet
Dim ds As DataSet = New DataSet
Dim table As DataTable = ds.Tables.Add("My Table")
table.Columns.Add(New DataColumn("Title"))
table.Columns.Add(New DataColumn("Price", GetType(System.Int32)))
Dim rnd As Random = New Random
Dim i As Integer = 0
Do While (i < 10)
Dim row As DataRow = table.NewRow
row("Title") = ("Title:" + i.ToString)
row("Price") = rnd.Next(1, 100)
table.Rows.Add(row)
i = (i + 1)
Loop
Return ds
End Function
</script>
<html>
<head>
<title>
Sample Pie</title>
</head>
<body>
<form id="form1" runat="server">
<web:chartcontrol runat="server" id="ChartControl1"
height="400" width="350" gridlines="none" legend-position="Bottom" />
</form>
</body>
</html>
Colorized by: CarlosAg.CodeColorizer
<%@ import namespace="System.Data"%>
<%@ register tagprefix="web" namespace="WebChart" assembly="WebChart"%>
<script runat="server">
void Page_Load(object o, EventArgs e) {
CreateChart();
}
void CreateChart() {
PieChart chart = new PieChart();
chart.DataSource = GetDataSet().Tables[0].DefaultView;
chart.DataXValueField = "Title";
chart.DataYValueField = "Price";
chart.DataLabels.Visible = true;
chart.DataLabels.ForeColor = System.Drawing.Color.Blue;
chart.Shadow.Visible = true;
chart.DataBind();
chart.Explosion = 10;
ChartControl1.Charts.Add(chart);
ChartControl1.RedrawChart();
}
DataSet GetDataSet() {
DataSet ds = new DataSet();
DataTable table = ds.Tables.Add("My Table");
table.Columns.Add(new DataColumn("Title"));
table.Columns.Add(new DataColumn("Price", typeof(int)));
Random rnd = new Random();
for (int i = 0; i < 10; i++) {
DataRow row = table.NewRow();
row["Title"] = "Title:" + i.ToString();
row["Price"] = rnd.Next(1, 100);
table.Rows.Add(row);
}
return ds;
}
</script>
<html>
<head>
<title>
Sample Pie</title>
</head>
<body>
<form id="form1" runat="server">
<web:chartcontrol runat="server" id="ChartControl1"
height="400" width="350" gridlines="none" legend-position="Bottom" />
</form>
</body>
</html>
VB.NET Code
<%@ page language="VB"%>
<%@ import namespace="System.Data"%>
<%@ register tagprefix="web" namespace="WebChart" assembly="WebChart"%>
<script runat='server'>
Sub Page_Load(ByVal o As Object, ByVal e As EventArgs)
CreateChart
End Sub
Sub CreateChart()
Dim chart As PieChart = New PieChart
chart.DataSource = GetDataSet.Tables(0).DefaultView
chart.DataXValueField = "Title"
chart.DataYValueField = "Price"
chart.DataLabels.Visible = true
chart.DataLabels.ForeColor = System.Drawing.Color.Blue
chart.Shadow.Visible = true
chart.DataBind
chart.Explosion = 10
ChartControl1.Charts.Add(chart)
ChartControl1.RedrawChart
End Sub
Function GetDataSet() As DataSet
Dim ds As DataSet = New DataSet
Dim table As DataTable = ds.Tables.Add("My Table")
table.Columns.Add(New DataColumn("Title"))
table.Columns.Add(New DataColumn("Price", GetType(System.Int32)))
Dim rnd As Random = New Random
Dim i As Integer = 0
Do While (i < 10)
Dim row As DataRow = table.NewRow
row("Title") = ("Title:" + i.ToString)
row("Price") = rnd.Next(1, 100)
table.Rows.Add(row)
i = (i + 1)
Loop
Return ds
End Function
</script>
<html>
<head>
<title>
Sample Pie</title>
</head>
<body>
<form id="form1" runat="server">
<web:chartcontrol runat="server" id="ChartControl1"
height="400" width="350" gridlines="none" legend-position="Bottom" />
</form>
</body>
</html>
Colorized by: CarlosAg.CodeColorizer
Carlos Aguilar Mares © 2017