WebChart Control Sample - Adding Shadow to Charts

Sample of using Shadow
This sample shows:
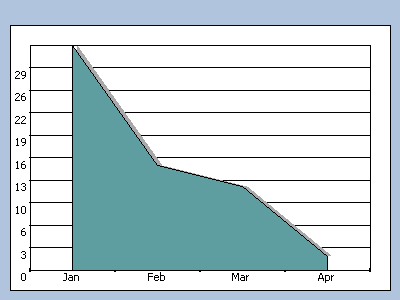
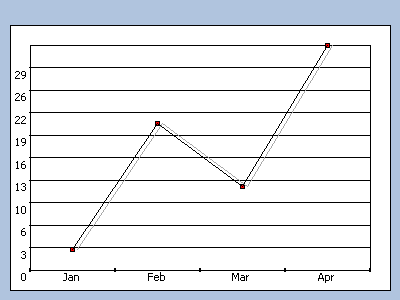
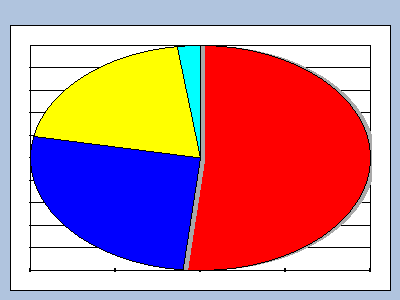
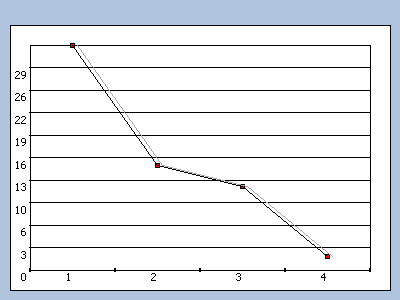
- How you can use the new Shadow property of the Charts to display enhance the look of your charts.
In the following sample everything is done declaratively to simplify the code, notice that you can set all the properties of the Shadow property declaratively or programmatically.
To enhance the shadow look I recommend using Alpha colors so that they give the impression of transparency, for example setting the color like this:
                chart1.Shadow.Color = Color.FromArgb(70, Color.DarkGray);
                chart1.Shadow.Visible = true;
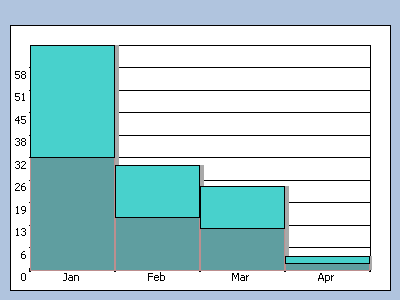
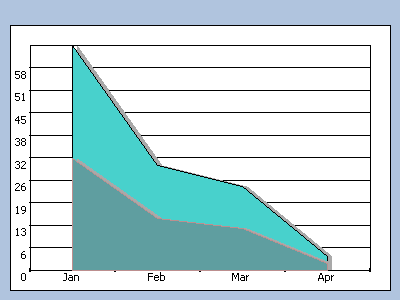
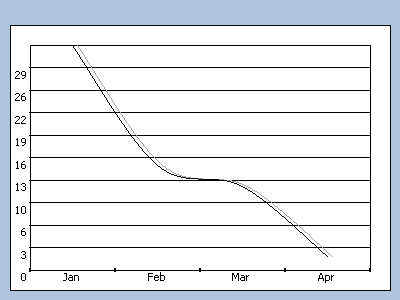
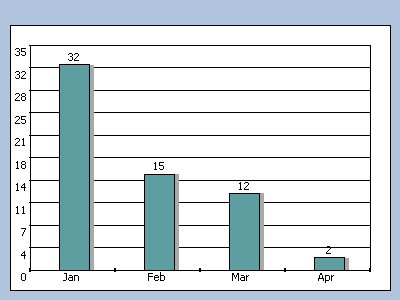
These are just a few samples of how the charts will look:
 |
 |
 |
 |
 |
 |
 |
 |
C# Code
The following page generates all the charts shown above.
<%@ Page language="c#"%>
<%@ Register tagPrefix="web" assembly="WebChart" namespace="WebChart"%>
<script runat=server>
private void Page_Load(object sender, System.EventArgs e) {
Chartcontrol1.RedrawChart();
Chartcontrol2.RedrawChart();
Chartcontrol3.RedrawChart();
Chartcontrol4.RedrawChart();
Chartcontrol5.RedrawChart();
Chartcontrol6.RedrawChart();
Chartcontrol7.RedrawChart();
Chartcontrol8.RedrawChart();
}
</script>
<html>
<head>
<title>shadow</title>
</head>
<body>
<form runat="server">
<web:chartcontrol id="Chartcontrol7" runat="server" HasChartLegend="False">
<Charts>
<web:StackedAreaChart ShowLegend="False" ShowLineMarkers="False">
<Fill CenterColor="Red" ForeColor="RosyBrown" Color="CadetBlue" />
<Data>
<web:ChartPoint XValue="Jan" YValue="32" />
<web:ChartPoint XValue="Feb" YValue="15" />
<web:ChartPoint XValue="Mar" YValue="12" />
<web:ChartPoint XValue="Apr" YValue="2" />
</Data>
<Shadow Visible="True" />
</web:StackedAreaChart>
<web:StackedAreaChart ShowLegend="False" ShowLineMarkers="False">
<Fill Color="MediumTurquoise" />
<Data>
<web:ChartPoint XValue="Jan" YValue="32" />
<web:ChartPoint XValue="Feb" YValue="15" />
<web:ChartPoint XValue="Mar" YValue="12" />
<web:ChartPoint XValue="Apr" YValue="2" />
</Data>
<Shadow Visible="True" />
</web:StackedAreaChart>
</Charts>
<XTitle StringFormat="Center,Near,Character,LineLimit" />
<YAxisFont StringFormat="Far,Near,Character,LineLimit" />
<ChartTitle StringFormat="Center,Near,Character,LineLimit" />
<XAxisFont StringFormat="Center,Near,Character,LineLimit" />
<Background Color="LightSteelBlue">
</Background>
<YTitle StringFormat="Center,Near,Character,LineLimit" />
</web:chartcontrol>
<Br>
<web:chartcontrol id="Chartcontrol8" runat="server" HasChartLegend="False">
<Charts>
<web:StackedColumnChart ShowLegend="False" ShowLineMarkers="False">
<Fill CenterColor="Red" ForeColor="RosyBrown" Color="CadetBlue" />
<Data>
<web:ChartPoint XValue="Jan" YValue="32" />
<web:ChartPoint XValue="Feb" YValue="15" />
<web:ChartPoint XValue="Mar" YValue="12" />
<web:ChartPoint XValue="Apr" YValue="2" />
</Data>
<Shadow Visible="True" />
<Line Color="RosyBrown" />
</web:StackedColumnChart>
<web:StackedColumnChart ShowLegend="False" ShowLineMarkers="False">
<Fill Color="MediumTurquoise">
</Fill>
<Data>
<web:ChartPoint XValue="Jan" YValue="32" />
<web:ChartPoint XValue="Feb" YValue="15" />
<web:ChartPoint XValue="Mar" YValue="12" />
<web:ChartPoint XValue="Apr" YValue="2" />
</Data>
</web:StackedColumnChart>
</Charts>
<XTitle StringFormat="Center,Near,Character,LineLimit" />
<YAxisFont StringFormat="Far,Near,Character,LineLimit" />
<ChartTitle StringFormat="Center,Near,Character,LineLimit" />
<XAxisFont StringFormat="Center,Near,Character,LineLimit" />
<Background Color="LightSteelBlue" />
<YTitle StringFormat="Center,Near,Character,LineLimit" />
</web:chartcontrol>
<BR>
<web:chartcontrol runat="server" id="Chartcontrol3" HasChartLegend="False">
<Charts>
<web:SmoothLineChart ShowLineMarkers="False">
<Fill Color="CadetBlue" />
<Data>
<web:ChartPoint XValue="Jan" YValue="32" />
<web:ChartPoint XValue="Feb" YValue="15" />
<web:ChartPoint XValue="Mar" YValue="12" />
<web:ChartPoint XValue="Apr" YValue="2" />
</Data>
<Shadow Visible="True" />
</web:SmoothLineChart>
</Charts>
<XTitle StringFormat="Center,Near,Character,LineLimit" />
<YAxisFont StringFormat="Far,Near,Character,LineLimit" />
<ChartTitle StringFormat="Center,Near,Character,LineLimit" />
<XAxisFont StringFormat="Center,Near,Character,LineLimit" />
<Background Color="LightSteelBlue" />
<YTitle StringFormat="Center,Near,Character,LineLimit" />
</web:chartcontrol>
<br>
<web:chartcontrol runat="server" id="Chartcontrol1" HasChartLegend="False">
<Charts>
<web:LineChart>
<Data>
<web:ChartPoint XValue="Jan" YValue="3" />
<web:ChartPoint XValue="Feb" YValue="21" />
<web:ChartPoint XValue="Mar" YValue="12" />
<web:ChartPoint XValue="Apr" YValue="32" />
</Data>
<Shadow Visible="True" />
</web:LineChart>
</Charts>
<XTitle StringFormat="Center,Near,Character,LineLimit" />
<YAxisFont StringFormat="Far,Near,Character,LineLimit" />
<ChartTitle StringFormat="Center,Near,Character,LineLimit" />
<XAxisFont StringFormat="Center,Near,Character,LineLimit" />
<Background Color="LightSteelBlue" />
<YTitle StringFormat="Center,Near,Character,LineLimit" />
</web:chartcontrol>
<br>
<web:chartcontrol runat="server" id="Chartcontrol2" HasChartLegend="False">
<Charts>
<web:ColumnChart MaxColumnWidth="30" ShowLineMarkers="False">
<Fill Color="CadetBlue" />
<Data>
<web:ChartPoint XValue="Jan" YValue="32" />
<web:ChartPoint XValue="Feb" YValue="15" />
<web:ChartPoint XValue="Mar" YValue="12" />
<web:ChartPoint XValue="Apr" YValue="2" />
</Data>
<Shadow Visible="True" />
</web:ColumnChart>
</Charts>
<XTitle StringFormat="Center,Near,Character,LineLimit" />
<YAxisFont StringFormat="Far,Near,Character,LineLimit" />
<ChartTitle StringFormat="Center,Near,Character,LineLimit" />
<XAxisFont StringFormat="Center,Near,Character,LineLimit" />
<Background Color="LightSteelBlue" />
<YTitle StringFormat="Center,Near,Character,LineLimit" />
</web:chartcontrol>
<br>
<web:chartcontrol runat="server" id="Chartcontrol4" HasChartLegend="False">
<Charts>
<web:AreaChart ShowLineMarkers="False">
<Fill Color="CadetBlue">
</Fill>
<Data>
<web:ChartPoint XValue="Jan" YValue="32" />
<web:ChartPoint XValue="Feb" YValue="15" />
<web:ChartPoint XValue="Mar" YValue="12" />
<web:ChartPoint XValue="Apr" YValue="2" />
</Data>
<Shadow Visible="True" />
</web:AreaChart>
</Charts>
<XTitle StringFormat="Center,Near,Character,LineLimit" />
<YAxisFont StringFormat="Far,Near,Character,LineLimit" />
<ChartTitle StringFormat="Center,Near,Character,LineLimit" />
<XAxisFont StringFormat="Center,Near,Character,LineLimit" />
<Background Color="LightSteelBlue" />
<YTitle StringFormat="Center,Near,Character,LineLimit" />
</web:chartcontrol>
<br>
<web:chartcontrol runat="server" id="Chartcontrol6" HasChartLegend="False">
<Charts>
<web:ScatterChart>
<Fill Color="CadetBlue">
</Fill>
<Shadow Visible="True">
</Shadow>
<Data>
<web:ChartPoint XValue="1" YValue="32" />
<web:ChartPoint XValue="2" YValue="15" />
<web:ChartPoint XValue="3" YValue="12" />
<web:ChartPoint XValue="4" YValue="2" />
</Data>
</web:ScatterChart>
</Charts>
<XTitle StringFormat="Center,Near,Character,LineLimit" />
<YAxisFont StringFormat="Far,Near,Character,LineLimit" />
<ChartTitle StringFormat="Center,Near,Character,LineLimit" />
<XAxisFont StringFormat="Center,Near,Character,LineLimit" />
<Background Color="LightSteelBlue" />
<YTitle StringFormat="Center,Near,Character,LineLimit" />
</web:chartcontrol>
<br>
<web:chartcontrol runat="server" id="Chartcontrol5" HasChartLegend="False">
<Charts>
<web:PieChart ShowLineMarkers="False">
<Fill Color="CadetBlue" />
<Data>
<web:ChartPoint XValue="Jan" YValue="32" />
<web:ChartPoint XValue="Feb" YValue="15" />
<web:ChartPoint XValue="Mar" YValue="12" />
<web:ChartPoint XValue="Apr" YValue="2" />
</Data>
<Shadow Visible="True" />
</web:PieChart>
</Charts>
<XTitle StringFormat="Center,Near,Character,LineLimit" />
<YAxisFont StringFormat="Far,Near,Character,LineLimit" />
<ChartTitle StringFormat="Center,Near,Character,LineLimit" />
<XAxisFont StringFormat="Center,Near,Character,LineLimit" />
<Background Color="LightSteelBlue" />
<YTitle StringFormat="Center,Near,Character,LineLimit" />
</web:chartcontrol>
</form>
</body>
</html>
Carlos Aguilar Mares © 2017