WebChart Control for ASP.NET Sample - using line markers with images

Sample of using images for Line Markers in a Chart
One of the original designs for WebChart was allowing developers to customize everything. As part of this effort, the line markers are implemented using a base class LineMarker.
This way developers can inherit from this class and override the Render method and do whatever they want.
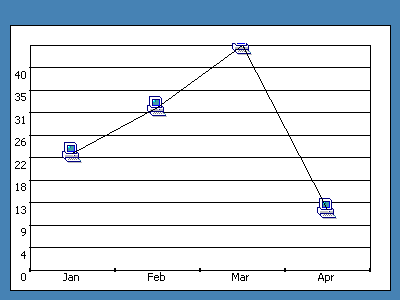
This small sample show how you can use this feature to render images for each point.
The output of this will look as follows:
C# Code
<%@ Page language="C#" %>
<%@ Register TagPrefix="Web" Namespace="WebChart" Assembly="WebChart" %>
<script runat=server>
private void Page_Load(object sender, System.EventArgs e) {
WebChart.LineChart l = new WebChart.LineChart();
l.Data.Add(new WebChart.ChartPoint("Jan", 23));
l.Data.Add(new WebChart.ChartPoint("Feb", 32));
l.Data.Add(new WebChart.ChartPoint("Mar", 44));
l.Data.Add(new WebChart.ChartPoint("Apr", 12));
l.LineMarker = new ImageLineMarker(Server.MapPath("images/mybullet.gif"));
chart1.Charts.Add(l);
chart1.RedrawChart();
}
class ImageLineMarker : WebChart.LineMarker {
private System.Drawing.Image image;
public ImageLineMarker(string filename) {
image = System.Drawing.Bitmap.FromFile(filename);
}
/// <summary>
/// Renders the LineMarker at the point specified using the graphics object.
/// </summary>
/// <param name="graphics">Graphics object to be used for rendering</param>
/// <param name="x">X coordinate to render the line marker</param>
/// <param name="y">Y coordinate to render the line marker</param>
public override void Render(System.Drawing.Graphics graphics, int x, int y) {
graphics.DrawImageUnscaled(image, x-image.Width/2,y-image.Height/2);
}
}
</script>
<HTML>
<HEAD />
<body>
<form runat="server">
<web:chartcontrol runat="server" id="chart1"
HasChartLegend="False"
Background-Color="SteelBlue"
/>
</form>
</body>
</HTML>
VB.NET Code
<%@ Page language="VB" %>
<%@ Register TagPrefix="Web" Namespace="WebChart" Assembly="WebChart" %>
<script runat=server>
private sub Page_Load(sender as object, e as System.EventArgs)
Dim l As New WebChart.LineChart()
l.Data.Add(new WebChart.ChartPoint("Jan", 23))
l.Data.Add(new WebChart.ChartPoint("Feb", 32))
l.Data.Add(new WebChart.ChartPoint("Mar", 44))
new WebChart.ChartPoint("Apr", 12))
l.LineMarker = new ImageLineMarker(Server.MapPath("images/mybullet.gif"))
chart1.Charts.Add(l)
chart1.RedrawChart()
end sub
class ImageLineMarker : Inherits WebChart.LineMarker
private image AS System.Drawing.Image
Public Sub New(filename as string )
image = System.Drawing.Bitmap.FromFile(filename)
End Sub
'/// <summary>
'/// Renders the LineMarker at the point specified using the graphics object.
'/// </summary>
'/// <param name="graphics">Graphics object to be used for rendering</param>
'/// <param name="x">X coordinate to render the line marker</param>
'/// <param name="y">Y coordinate to render the line marker</param>
public overrides sub Render(graphics as System.Drawing.Graphics, x as integer, y as integer)
graphics.DrawImageUnscaled(image, x-image.Width/2,y-image.Height/2)
end sub
end class
</script>
<HTML>
<HEAD />
<body>
<form runat="server">
<web:chartcontrol runat="server" id="chart1"
HasChartLegend="False"
Background-Color="SteelBlue"
/>
</form>
</body>
</HTML>
Carlos Aguilar Mares © 2017