WebChart Control Sample - Code

Sample
- Simple C# Code
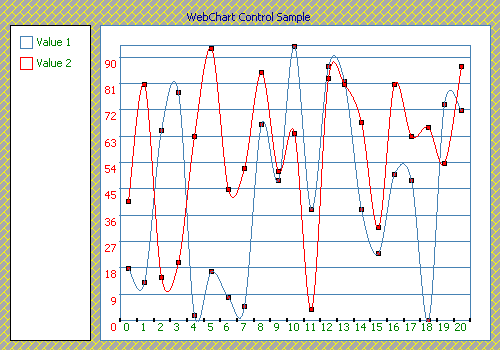
- Simple VB.NET Binding to a DataSet
- Simple WinForms
- Sample of using the Chart control without saving to the file system
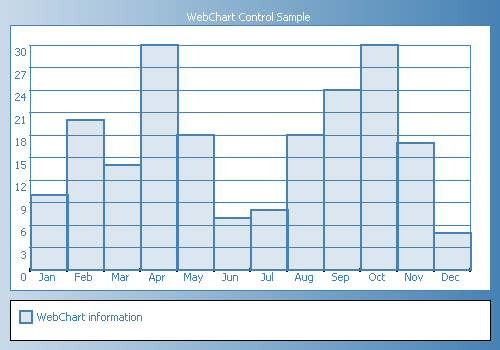
Simple C# Code
<%@ Page Language="C#" %>
<%@ Register tagPrefix="Web" Namespace="WebChart" Assembly="WebChart" %>
<%@ Import Namespace="System.Drawing" %>
<script runat=server>
private void Page_Load(object sender, System.EventArgs e) {
ColumnChart chart = new ColumnChart();
chart.Fill.Color = Color.FromArgb(50, Color.SteelBlue);
chart.Line.Color = Color.SteelBlue;
chart.Line.Width = 2;
chart.Legend = "WebChart information";
chart.Data.Add( new ChartPoint("Jan", 10) );
chart.Data.Add( new ChartPoint("Feb", 20) );
chart.Data.Add( new ChartPoint("Mar", 14) );
chart.Data.Add( new ChartPoint("Apr", 30) );
chart.Data.Add( new ChartPoint("May", 18) );
chart.Data.Add( new ChartPoint("Jun", 7) );
chart.Data.Add( new ChartPoint("Jul", 8) );
chart.Data.Add( new ChartPoint("Aug", 18) );
chart.Data.Add( new ChartPoint("Sep", 24) );
chart.Data.Add( new ChartPoint("Oct", 30) );
chart.Data.Add( new ChartPoint("Nov", 17) );
chart.Data.Add( new ChartPoint("Dec", 5) );
ConfigureColors();
ChartControl1.Charts.Add(chart);
ChartControl1.RedrawChart();
}
// Configure some colors for the Chart, this could be done declaratively also
private void ConfigureColors() {
ChartControl1.Background.Color = Color.FromArgb(75, Color.SteelBlue);
ChartControl1.Background.Type = InteriorType.LinearGradient;
ChartControl1.Background.ForeColor = Color.SteelBlue;
ChartControl1.Background.EndPoint = new Point(500, 350) ;
ChartControl1.Legend.Position = LegendPosition.Bottom;
ChartControl1.Legend.Width = 40;
ChartControl1.YAxisFont.ForeColor = Color.SteelBlue;
ChartControl1.XAxisFont.ForeColor = Color.SteelBlue;
ChartControl1.ChartTitle.Text = "WebChart Control Sample";
ChartControl1.ChartTitle.ForeColor = Color.White;
ChartControl1.Border.Color = Color.SteelBlue;
ChartControl1.BorderStyle = BorderStyle.Ridge;
}
</script>
<html>
<head><title>WebChart Sample</title></head>
<body>
<Web:ChartControl Width="500" Height="350" id="ChartControl1" runat="Server" />
</body>
</html>
Simple VB.NET Binding to a DataSet
<%@ Register tagPrefix="Web" Namespace="WebChart" Assembly="WebChart" %>
<%@ Import Namespace="System.Drawing" %>
<script runat=server>
private void Page_Load(object sender, System.EventArgs e) {
ColumnChart chart = new ColumnChart();
chart.Fill.Color = Color.FromArgb(50, Color.SteelBlue);
chart.Line.Color = Color.SteelBlue;
chart.Line.Width = 2;
chart.Legend = "WebChart information";
chart.Data.Add( new ChartPoint("Jan", 10) );
chart.Data.Add( new ChartPoint("Feb", 20) );
chart.Data.Add( new ChartPoint("Mar", 14) );
chart.Data.Add( new ChartPoint("Apr", 30) );
chart.Data.Add( new ChartPoint("May", 18) );
chart.Data.Add( new ChartPoint("Jun", 7) );
chart.Data.Add( new ChartPoint("Jul", 8) );
chart.Data.Add( new ChartPoint("Aug", 18) );
chart.Data.Add( new ChartPoint("Sep", 24) );
chart.Data.Add( new ChartPoint("Oct", 30) );
chart.Data.Add( new ChartPoint("Nov", 17) );
chart.Data.Add( new ChartPoint("Dec", 5) );
ConfigureColors();
ChartControl1.Charts.Add(chart);
ChartControl1.RedrawChart();
}
// Configure some colors for the Chart, this could be done declaratively also
private void ConfigureColors() {
ChartControl1.Background.Color = Color.FromArgb(75, Color.SteelBlue);
ChartControl1.Background.Type = InteriorType.LinearGradient;
ChartControl1.Background.ForeColor = Color.SteelBlue;
ChartControl1.Background.EndPoint = new Point(500, 350) ;
ChartControl1.Legend.Position = LegendPosition.Bottom;
ChartControl1.Legend.Width = 40;
ChartControl1.YAxisFont.ForeColor = Color.SteelBlue;
ChartControl1.XAxisFont.ForeColor = Color.SteelBlue;
ChartControl1.ChartTitle.Text = "WebChart Control Sample";
ChartControl1.ChartTitle.ForeColor = Color.White;
ChartControl1.Border.Color = Color.SteelBlue;
ChartControl1.BorderStyle = BorderStyle.Ridge;
}
</script>
<html>
<head><title>WebChart Sample</title></head>
<body>
<Web:ChartControl Width="500" Height="350" id="ChartControl1" runat="Server" />
</body>
</html>
<%@ Page Language="VB" %>
<%@ Register tagPrefix="Web" Namespace="WebChart" Assembly="WebChart" %>
<%@ Import Namespace="System.Drawing" %>
<%@ Import Namespace="System.Data" %>
<script runat=server>
Sub Page_Load(ByVal sender As Object, ByVal e As System.EventArgs)
Dim ds As DataSet = GetDataSet()
Dim view As DataView = ds.Tables(0).DefaultView
Dim chart As New SmoothLineChart()
chart.Line.Color = Color.SteelBlue
chart.Legend = "Value 1"
chart.DataSource = view
chart.DataXValueField = "Description"
chart.DataYValueField = "Value1"
chart.DataBind()
ChartControl1.Charts.Add(chart)
Dim chart1 As New SmoothLineChart()
chart1.Line.Color = Color.Red
chart1.Legend = "Value 2"
chart1.DataSource = view
chart1.DataXValueField = "Description"
chart1.DataYValueField = "Value2"
chart1.DataBind()
ChartControl1.Charts.Add(chart1)
ConfigureColors()
ChartControl1.RedrawChart()
End Sub
' Just create a simple dataset
Private Function GetDataSet() As DataSet
Dim ds As New DataSet()
Dim table As DataTable = ds.Tables.Add("Data")
table.Columns.Add("Description")
table.Columns.Add("Value1", GetType(Integer))
table.Columns.Add("Value2", GetType(Integer))
Dim rnd As New Random()
Dim i As Integer
For i = 0 To 20
Dim row As DataRow = table.NewRow()
row("Description") = i.ToString()
row("Value1") = rnd.Next(100)
row("Value2") = rnd.Next(100)
table.Rows.Add(row)
Next
Return ds
End Function
' Configure some colors for the Chart, this could be done declaratively also
Sub ConfigureColors()
ChartControl1.Background.Color = Color.DarkGray
ChartControl1.Background.Type = InteriorType.Hatch
ChartControl1.Background.HatchStyle = System.Drawing.Drawing2D.HatchStyle.DiagonalBrick
ChartControl1.Background.ForeColor = Color.Yellow
ChartControl1.Background.EndPoint = New Point(500, 350)
ChartControl1.Legend.Position = LegendPosition.Left
ChartControl1.Legend.Width = 80
ChartControl1.YAxisFont.ForeColor = Color.Red
ChartControl1.XAxisFont.ForeColor = Color.Green
ChartControl1.ChartTitle.Text = "WebChart Control Sample"
ChartControl1.ChartTitle.ForeColor = Color.DarkBlue
ChartControl1.Border.Color = Color.SteelBlue
ChartControl1.BorderStyle = BorderStyle.Ridge
End Sub
</script>
<html>
<head><title>WebChart Sample</title></head>
<body>
<Web:ChartControl Width="500" Height="350" id="ChartControl1" runat="Server" />
</body>
</html>
Simple WinForms
For WinForms you can use the ChartEngine class directly that exposes all the rendering capabilities of the ChartControl using the same object model.
This ChartEngine can also be used from ASP.NET and is a good candidate for creating a handler that can render the Chart without saving it to the file system.
<%@ Register tagPrefix="Web" Namespace="WebChart" Assembly="WebChart" %>
<%@ Import Namespace="System.Drawing" %>
<%@ Import Namespace="System.Data" %>
<script runat=server>
Sub Page_Load(ByVal sender As Object, ByVal e As System.EventArgs)
Dim ds As DataSet = GetDataSet()
Dim view As DataView = ds.Tables(0).DefaultView
Dim chart As New SmoothLineChart()
chart.Line.Color = Color.SteelBlue
chart.Legend = "Value 1"
chart.DataSource = view
chart.DataXValueField = "Description"
chart.DataYValueField = "Value1"
chart.DataBind()
ChartControl1.Charts.Add(chart)
Dim chart1 As New SmoothLineChart()
chart1.Line.Color = Color.Red
chart1.Legend = "Value 2"
chart1.DataSource = view
chart1.DataXValueField = "Description"
chart1.DataYValueField = "Value2"
chart1.DataBind()
ChartControl1.Charts.Add(chart1)
ConfigureColors()
ChartControl1.RedrawChart()
End Sub
' Just create a simple dataset
Private Function GetDataSet() As DataSet
Dim ds As New DataSet()
Dim table As DataTable = ds.Tables.Add("Data")
table.Columns.Add("Description")
table.Columns.Add("Value1", GetType(Integer))
table.Columns.Add("Value2", GetType(Integer))
Dim rnd As New Random()
Dim i As Integer
For i = 0 To 20
Dim row As DataRow = table.NewRow()
row("Description") = i.ToString()
row("Value1") = rnd.Next(100)
row("Value2") = rnd.Next(100)
table.Rows.Add(row)
Next
Return ds
End Function
' Configure some colors for the Chart, this could be done declaratively also
Sub ConfigureColors()
ChartControl1.Background.Color = Color.DarkGray
ChartControl1.Background.Type = InteriorType.Hatch
ChartControl1.Background.HatchStyle = System.Drawing.Drawing2D.HatchStyle.DiagonalBrick
ChartControl1.Background.ForeColor = Color.Yellow
ChartControl1.Background.EndPoint = New Point(500, 350)
ChartControl1.Legend.Position = LegendPosition.Left
ChartControl1.Legend.Width = 80
ChartControl1.YAxisFont.ForeColor = Color.Red
ChartControl1.XAxisFont.ForeColor = Color.Green
ChartControl1.ChartTitle.Text = "WebChart Control Sample"
ChartControl1.ChartTitle.ForeColor = Color.DarkBlue
ChartControl1.Border.Color = Color.SteelBlue
ChartControl1.BorderStyle = BorderStyle.Ridge
End Sub
</script>
<html>
<head><title>WebChart Sample</title></head>
<body>
<Web:ChartControl Width="500" Height="350" id="ChartControl1" runat="Server" />
</body>
</html>
You can also use the ChartControl directly.
//--------------------------------------
// Create The Chart
ChartEngine engine = new ChartEngine();
engine.Size = pictureBox1.Size;
ChartCollection charts = new ChartCollection(engine);
engine.Charts = charts;
int chartCount=0, pointCount=0;
ChartPointCollection data = new ChartPointCollection();
Chart line = new LineChart(data, Color.Red);
line.ShowLineMarkers=false;
for (pointCount=0 ; pointCount< maxPoints; pointCount++) {
data.Add( new ChartPoint("Some Data", pointCount) );
}
charts.Add( line );
engine.GridLines = GridLines.Horizontal;
Image image = engine.GetBitmap();
//--------------------------------------
// At this point we have the chart already
//--------------------------------------
// show the already generated image
pictureBox1.Image = image;
This is how the charts created above look like:// Create The Chart
ChartEngine engine = new ChartEngine();
engine.Size = pictureBox1.Size;
ChartCollection charts = new ChartCollection(engine);
engine.Charts = charts;
int chartCount=0, pointCount=0;
ChartPointCollection data = new ChartPointCollection();
Chart line = new LineChart(data, Color.Red);
line.ShowLineMarkers=false;
for (pointCount=0 ; pointCount< maxPoints; pointCount++) {
data.Add( new ChartPoint("Some Data", pointCount) );
}
charts.Add( line );
engine.GridLines = GridLines.Horizontal;
Image image = engine.GetBitmap();
//--------------------------------------
// At this point we have the chart already
//--------------------------------------
// show the already generated image
pictureBox1.Image = image;
Carlos Aguilar Mares © 2017