Sample Code to add Legends to a Pie Chart
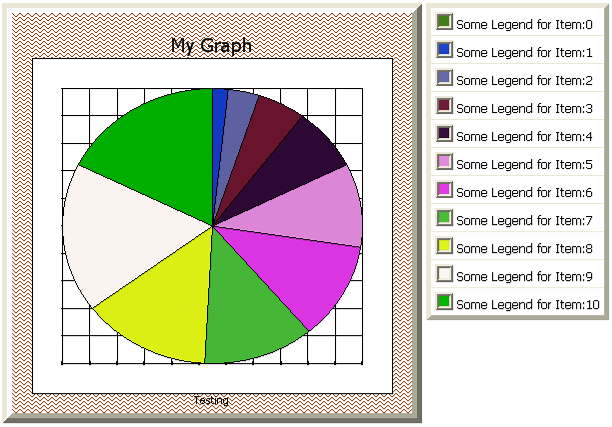
At the bottom you can see how the page looks like and also the code in C#.<%@ page language="VB" %>The code above will generate this page.
<%@ import namespace="System.Drawing" %>
<%@ register tagprefix="Web" namespace="WebChart" assembly="WebChart"%>
< script runat ="server">
Public Sub Page_Load(o As Object, E as EventArgs)
If Page.IsPostBack = False Then
Dim chart As New PieChart()
Dim i As Integer
Dim count As Integer = 10
Dim data As ItemData(), rnd As New Random()
ReDim data(count)
For i = 0 To count
chart.Data.Add(New ChartPoint(i.ToString(), i))
data(i) = New ItemData()
data(i).Color = Color.FromArgb(rnd.Next(255), rnd.Next(255), rnd.Next(255))
data(i).Legend = "Some Legend for Item:" + i.ToString()
Next
Dim colors(count) As Color
For i = 0 To count
colors(i) = data(i).Color
Next
chart.Colors = colors
'Add it to the Charts Collection and Display
ChartControl1.Charts.Add(chart)
ChartControl1.RedrawChart()
dl.DataSource = data
dl.DataBind()
End If
End Sub
Public Class ItemData
Private _color As Color
Private _legend As String
Public Property Color() As Color
Get
Return _color
End Get
Set(ByVal Value As Color)
_color = Value
End Set
End Property
Public Property Legend() As String
Get
Return _legend
End Get
Set(ByVal Value As String)
_legend = Value
End Set
End Property
End Class
</script>
<html>
<body>
<form id="Form1" runat="server">
<table>
<tr>
<td valign=TOP>
<web:chartcontrol haschartlegend=false id="ChartControl1" runat="server" enableviewstate="true" borderstyle="Outset"
borderwidth="10px" height="400px" width="400px" alternatetext="My Graph" toppadding="25"
padding="20" chartpadding="30" backcolor="SaddleBrown" tooltip="My chart" gridlines="Both">
<ytitle forecolor="Black" font="Tahoma, 8pt"></ytitle>
<charttitle forecolor="Black" text="My Graph" font="Tahoma, 14pt"></charttitle>
<xtitle forecolor="Black" text="Testing" font="Tahoma, 8pt"></xtitle>
<background type="Hatch" startpoint="0, 0" forecolor="SaddleBrown" endpoint="0, 100"
color="Snow" hatchstyle="ZigZag"></background>
<border endcap="Flat" dashstyle="Solid" startcap="Flat" color="Black" width="1" linejoin="Bevel"></border>
<plotbackground type="Solid" startpoint="0, 10" forecolor="Tan" endpoint="600, 100"
color="White" hatchstyle="Shingle"></plotbackground>
<yaxisfont forecolor="Black" font="Tahoma, 8pt"></yaxisfont>
<xaxisfont forecolor="Black" font="Tahoma, 8pt"></xaxisfont>
<legend width="110" font="Tahoma, 6.75pt">
<border endcap="Flat" dashstyle="Solid" startcap="Flat" color="Black" width="1" linejoin="Miter"></border>
<background type="Solid" startpoint="0, 0" forecolor="Black" endpoint="0, 100" color="White"
hatchstyle="Horizontal"></background>
</legend>
</web:chartcontrol>
</td>
<td valign=top>
<asp:datalist gridlines=both runat=server id="dl" BorderStyle=Outset borderwidth=5 cellpadding=4 font-name="Tahoma" font-size="9pt">
<itemtemplate>
<asp:label runat=server backcolor='<%#Container.DataItem.Color %>' id=color text=' ' width="18px" height="18px" borderstyle=Ridge font-size="4pt" />
<asp:label runat=server text='<%# Container.DataItem.Legend %>' />
</itemtemplate>
</asp:datalist>
</td>
</tr>
</table>
</form>
</body>
</html>

C# Code
<%@ page language="C#"%>
<%@ import namespace="System.Drawing"%>
<%@ register tagprefix="Web" namespace="WebChart" assembly="WebChart"%>
<script runat="server">
        private void Page_Load(object sender, System.EventArgs e)
        {
            if (Page.IsPostBack == false)
            {
                PieChart chart = new PieChart();
                int count=10;
                ItemData[] data = new ItemData[count];
                Random rnd = new Random();
                for (int i=0; i<count; i++)
                {
                    chart.Data.Add(new ChartPoint(i.ToString(), i));
                    data[i] = new ItemData();
                    data[i].Color = Color.FromArgb(rnd.Next(255), rnd.Next(255), rnd.Next(255));
                    data[i].Legend = "Some Legend for Item:" + i.ToString();
                }

                Color[] colors = new Color[count];
                for (int i = 0 ; i<count; i++)
                {
                    colors[i] = data[i].Color;
                }
                chart.Colors = colors;
                //Add it to the Charts Collection and Display
                ChartControl1.Charts.Add(chart);
                ChartControl1.RedrawChart();

                dl.DataSource = data;
                dl.DataBind();
            }
        }
        protected class ItemData
        {
            private Color _color;
            private string _legend;
            public Color Color
            {
                get
                {
                    return _color;
                }
                set
                {
                    _color = value;
                }
            }
            public string Legend
            {
                get
                {
                    return _legend;
                }
                set
                {
                    _legend = value;
                }
            }
        }
</script>
<html>
    <body>
        <form id="Form1" runat="server">
            <table>
                <tr>
                    <td valign="top">
                        <web:chartcontrol haschartlegend="false" id="ChartControl1" runat="server" enableviewstate="true"
                            borderstyle="Outset" borderwidth="10px" height="400px" width="400px" alternatetext="My Graph"
                            toppadding="25" padding="20" chartpadding="30" backcolor="SaddleBrown" tooltip="My chart"
                            gridlines="Both">
                            <ytitle forecolor="Black" font="Tahoma, 8pt">
                            </ytitle>
                            <charttitle forecolor="Black" text="My Graph" font="Tahoma, 14pt" />
                            <xtitle forecolor="Black" text="Testing" font="Tahoma, 8pt" />
                            <background type="Hatch" startpoint="0, 0" forecolor="SaddleBrown" endpoint="0, 100"
                                color="Snow" hatchstyle="ZigZag" />
                            <border endcap="Flat" dashstyle="Solid" startcap="Flat" color="Black" width="1" linejoin="Bevel" />
                            <plotbackground type="Solid" startpoint="0, 10" forecolor="Tan" endpoint="600, 100"
                                color="White" hatchstyle="Shingle" />
                            <yaxisfont forecolor="Black" font="Tahoma, 8pt" />
                            <xaxisfont forecolor="Black" font="Tahoma, 8pt" />
                            <legend width="110" font="Tahoma, 6.75pt">
                                <border endcap="Flat" dashstyle="Solid" startcap="Flat" color="Black" width="1" linejoin="Miter" />
                                <background type="Solid" startpoint="0, 0" forecolor="Black" endpoint="0, 100" color="White"
                                    hatchstyle="Horizontal" />
                            </legend>
                        </web:chartcontrol>
                    </td>
                    <td valign="top">
                        <asp:datalist gridlines="both" runat="server" id="dl" borderstyle="Outset" borderwidth="5"
                            cellpadding="4" font-name="Tahoma" font-size="9pt">
                            <itemtemplate>
                                <asp:label runat="server" backcolor='<%# ((ItemData)Container.DataItem).Color %>'
                                    id="color" text=' ' width="18px" height="18px" borderstyle="Ridge" font-size="4pt" />
                                <asp:label runat="server" text='<%# ((ItemData)Container.DataItem).Legend %>' id="Label1" />
                            </itemtemplate>
                        </asp:datalist>
                    </td>
                </tr>
            </table>
        </form>
    </body>
</html>
Carlos Aguilar Mares © 2017
