WebChart Control Sample - New Pie Chart

Sample of new PieChart features
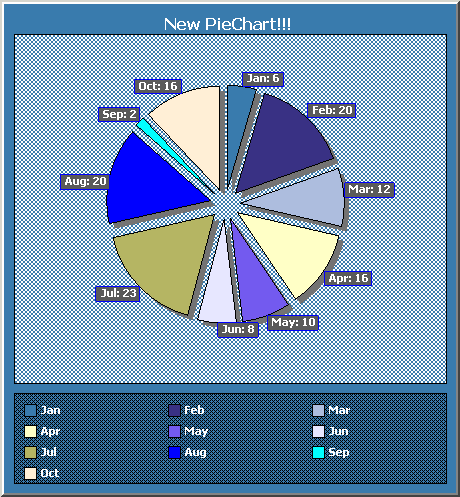
This sample shows:
- New property Explosion on PieChart to create the effect of exploded Pie.
- Support for shadows
- New support for DataLabels in the Pie
- New support for Legend for PieChart
This is how the chart looks like, just copy/paste the code into notepad and save it as .aspx:
Code
The code below does everything declaratively to make it simple and language agnostic. However all of the features shown here can be used programmatically as well.The most important features shown below are the Explosion property, DataLabels and Legend.
You can set the properties pogrammatically as follows:
                PieChart chart = new PieChart();
                chart.Explosion = 15;
                chart.DataLabels.Visible=true;
                chart.DataLabels.ShowXTitle = true;
                chart.DataLabels.Separator=":";
                chartcontrol1.HasChartLegend = true;
<%@ Page language="c#" %>
<%@ Register tagPrefix="web" Assembly="WebChart" Namespace="WebChart" %>
<script runat=server>
void Page_Load(object o, EventArgs e) {
chartcontrol1.RedrawChart();
}
</script>
<HTML>
<HEAD>
<title>Sample Pie</title>
</HEAD>
<body>
<form runat="server">
<web:chartcontrol id="chartcontrol1" runat="server" Background-Type="Hatch" Width="452px" Height="489px" GridLines="None" HasChartLegend="True" BorderStyle="Outset" TopPadding="20" ChartPadding="0">
<Charts>
<web:PieChart Legend="Some Legend" Explosion="15">
<DataLabels Font="Tahoma, 8pt, style=Bold" ForeColor="White" Separator=": " Visible="True" ShowXTitle="True">
<Background ForeColor="White" Color="DimGray" />
<Border Color="Blue" />
</DataLabels>
<Data>
<web:ChartPoint XValue="Jan" YValue="6" />
<web:ChartPoint XValue="Feb" YValue="20" />
<web:ChartPoint XValue="Mar" YValue="12" />
<web:ChartPoint XValue="Apr" YValue="16" />
<web:ChartPoint XValue="May" YValue="10" />
<web:ChartPoint XValue="Jun" YValue="8" />
<web:ChartPoint XValue="Jul" YValue="23" />
<web:ChartPoint XValue="Aug" YValue="20" />
<web:ChartPoint XValue="Sep" YValue="2" />
<web:ChartPoint XValue="Oct" YValue="16" />
</Data>
<Shadow OffsetY="5" Color="Gray" Visible="True" />
</web:PieChart>
</Charts>
<ChartTitle ForeColor="White" Text="New PieChart!!!" Font="Tahoma, 12pt, style=Bold" />
<XAxisFont ForeColor="White" StringFormat="Center,Near,Character,LineLimit" />
<Legend Position="Bottom" Width="90" Font="Tahoma, 8.25pt, style=Bold">
<Background Type="Hatch" Color="Transparent" HatchStyle="Percent30" />
</Legend>
<Background Color="SteelBlue" HatchStyle="LargeGrid" />
<YTitle StringFormat="Center,Near,Character,LineLimit" />
<PlotBackground Type="Hatch" ForeColor="White" Color="Transparent" HatchStyle="SmallCheckerBoard" />
</web:chartcontrol>
</form>
</body>
</HTML>
Carlos Aguilar Mares © 2017