WebChart Control for ASP.NET
Free Chart control for ASP.NET.

|
WebControl for creating charts, that render as images(png, jpg, gif, etc). Supports:
|
Download
I'm constantly making updates to the Chart control fixing bugs and adding features, so if you want to know when a new release is dropped, send an email to updates@carlosag.net and I will send you an email when a new update is ready.Click Here to Start Downloading the control (36 kb)
Number of Downloads: <%= string.Format("{0}", Globals.Downloads["WebChart.zip"]) %>Click Here to Start Downloading the Help file (.zip) (255 kb)
Number of Downloads:<%= string.Format("{0}", Globals.Downloads["WebChart.chm"]) %>
Note: If you have problems when running the chart or have any question, please see this:
FAQ (Frequently Asked Questions)
Some useful information
Jumpstart Tutorial | More chart samples | Simple C# and VB.NET Sample Code | Code Demo Samples
History:
New sample: This sample shows how to create a Chart with multiple Columns.
New sample: This sample shows how to create a Stacked Column Chart.
v1.1.1.4 Released: 12/9/2004
- This version is compiled against .NET v1.1 (Everett). Starting with this version I decided to drop v1.0 version and only support v1.1 and later.
- Enabled AntiAlias and Smoothing, so the charts should look nicer.
- StackedColumnChart now supports MaxColumnWidth as well.
- Small bug fixes.
New sample: This sample shows how to display data from Microsoft Access using a Chart Control.
New sample: Another sample of using the Chart control without saving to the file system
New sample: Sample of using the Chart control to generate Pie Charts with external Legends
v1.1.1.3 Released: 01/21/2004
- Enhanced Design time support to enhance Intellisense in future releases of VS.
- Bug Fix: When having multiple ScatterCharts displaying Date's it uses different scales for each one.
- Bug Fix: when using multiple ColumnCharts and using DataLabels, all datalabels are centered in the chart that is at the middle, instead of at the center of each column.
- Bug Fix: When using a PieChart that one of the slices started between 0-90 and ended between 90-180 the DataLabel was rendering inside the pie slice.
New sample: This sample shows to bind a DataSet to a PieChart (or any other chart).
New sample: This sample shows the new features of the PieChart, including new Explosion feature and DataLabels and Legend support.
v1.1.1.2 Released: 12/06/2003
-
New Exciting Features for PieChart: With this version PieChart offers new
Explosion support and long-waited DataLabels and Legend Support.
See the above sample to see how these features make PieChart finally a first class citizen.
New sample: How to enhance the look of the charts using shadows.
v1.1.1.1 Released: 12/04/2003
- New Shadow support: Added new support for shadows to all the charts. New Class ChartShadow and new property Shadow in Chart class.
- Adjusting Rendering for DataLabels: Previously when using datalabels the maximum values used to lost the datalabel since it render outside the chart area, now it will automatically adjust only when using datalabels.
v1.1.1.0 Released: 12/01/2003
- Small bug fix
New sample: How to show data on top of each point, set the maximum value of a chart, and customize the width of a ColumnChart.
New sample: How to resize the chart control programmatically.
v1.1.0.9 Released: 11/01/2003
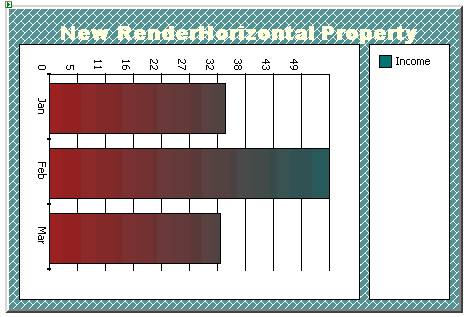
- New Property RenderHorizontally: There is a new property in both ChartEngine and ChartControl called RenderHorizontally that rotates the chart horizontally, so now you can have charts like the one below:
- Defer checking of the physical path only when required, so scenarios of creating charts that does not save the image to disk will work without ever worrying of the temporary folder.
- Enhanced error messages reporting.
- New sample: How to create horizontal charts.
New sample: How to add images as Line markers for a chart.
v1.1.0.8 Released: 10/22/2003
- Fixed the problem with SmoothLinesChart when only one point was available. Now SmoothLineChart inherits from LineChart, and if there are only one point it will use the line rendering.
v1.1.0.7 Released: 10/17/2003
-
Enhanced the Design Time serialization so that it only serializes properties required,
and not the whole properties which makes the ASPX code cleaner and will make the
charts run faster, since less properties will be set.
This is not a breaking change.
New sample: How to create a chart without saving to the file system.
v1.1.0.6 Released: 08/27/2003
- Bug Fix: When Impersonation is set to true and the ASPNET account does not have permissions on the folder, the first request fails with UnauthorizedException.
- Bug Fix: YValuesInterval in the control changed to float value.
- Bug Fix: Division By zero when setting the MaxColumnWidth in a ColumnChart and only one chart in the control
- Bug Fix: Can't set the YValuesInterval to a float value. Fix: Changed the type of YValuesInterval, YCustomStart, YCustomEnd to be float.
New: Here are two samples of using the Chart in WinForms. Simple Winforms Demo | Another Winforms Demo
Please send any comments, questions or features you would like to see to webchart@carlosag.net
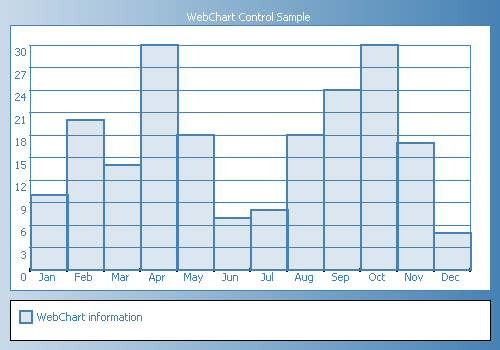
This is just one sample chart just to show the things it can do. This was actually generated by the control with just about 20 lines of code, to see the code, click the sample code link above.
Carlos Aguilar Mares © 2017